Hong Kong IT Manpower
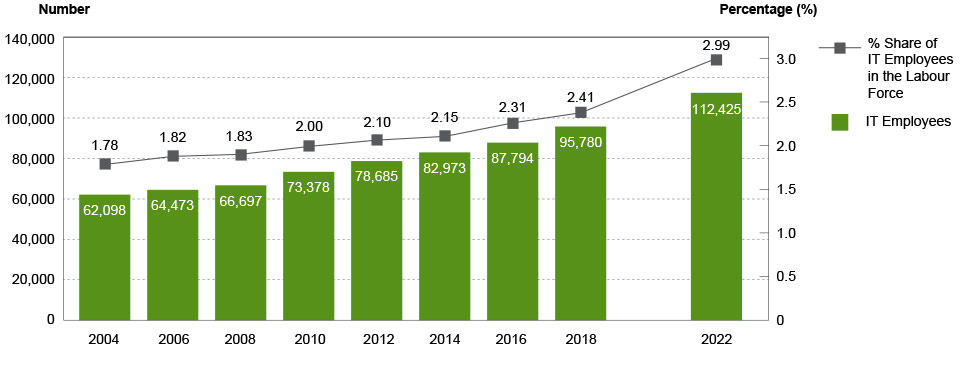
IT Employees (Year 2004 – 2022)
The labour market in the information technology (IT) sector of Hong Kong keeps steady growth in April 2022 with total IT employment rose to 112 425 IT employees (including freelancers), representing an increase of 17.4% over April 2018 (95 780 IT employees) and 81.0% over March 2004 (62 098 IT employees). Owing to decrease in the total labour force, the percentage share of IT employees (including freelancers) in the labour force grew from 2.41% in April 2018 to 2.99% in April 2022.
| March 2004 | April 2006 | May 2008 | May 2010 | May 2012 | April 2014 | April 2016 | April 2018 | April 2022 | |
|---|---|---|---|---|---|---|---|---|---|
| Labour Force* (‘000) | 3,495.6 | 3,550.2 | 3,654.3 | 3,644.0 | 3,796.9 | 3,861.5 | 3,807.1 | 3,982.2 | 3,750.2 |
| IT Employees | 62,098 | 64,473 | 66,697 | 73,378 | 78,685 | 82,973 | 87,794 | 95,780 | 112,425 |
|
26,238 | 27,438 | 32,549 | 34,764 | 39,466 | 40,954 | 44,672 | 53,273 | 64,751 |
|
35,860 | 37,035 | 34,148 | 38,614 | 39,219 | 42,019 | 43,122 | 42,507 | 47,674 |
| Percentage Share of IT Employees in the Labour Force (%) | 1.78 | 1.82 | 1.83 | 2.00 | 2.10 | 2.15 | 2.31 | 2.41 | 2.99 |
*Source: Census and Statistics Department
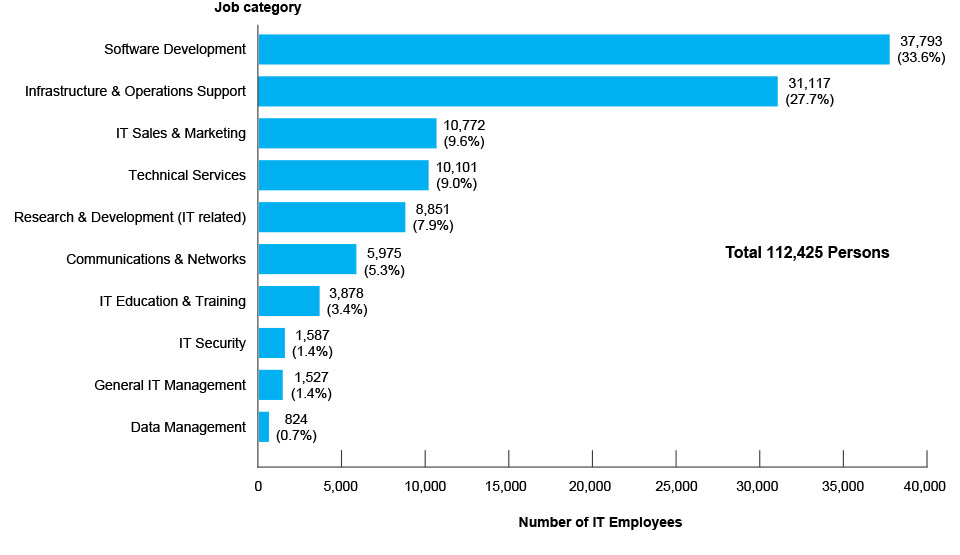
IT Employees by Job Category (Year 2022)
Of the 112 425 IT employees (including freelancers), 37 793 (33.6%) were in Software development, 31 117 (27.7%) in infrastructure & operation support, 10 772 (9.6%) in IT sales & marketing, 10 101 (9.0%) in technical services, 8 851 (7.9%) in research & development (IT related), 5 975 (5.3%) in communications & networks, 3 878 (3.4%) in IT education & training, and the rest in IT security, general IT management and data management.
| Job Category | Number of IT Employees | Percentage of IT Employees |
|---|---|---|
| Software Development | 37,793 | 33.6% |
| Infrastructure & Operations Support | 31,117 | 27.7% |
| IT Sales & Marketing | 10,772 | 9.6% |
| Technical Services | 10,101 | 9.0% |
| Research & Development (IT related) | 8,851 | 7.9% |
| Communications & Networks | 5,975 | 5.3% |
| IT Education & Training | 3,878 | 3.4% |
| IT Security | 1,587 | 1.4% |
| General IT Management | 1,527 | 1.4% |
| Data Management | 824 | 0.7% |
| Total | 112,425 | 100.0% |
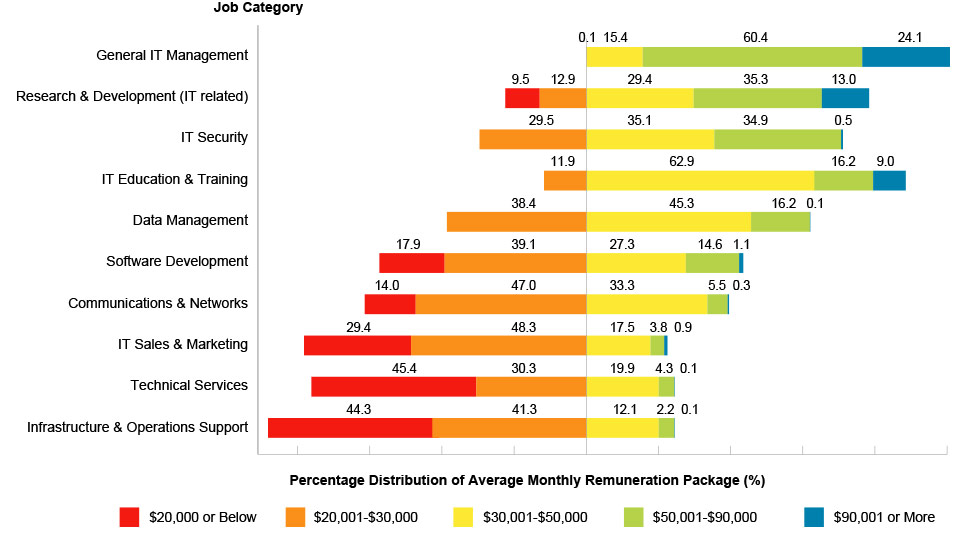
Distribution of Average Monthly Remuneration Package of Full-time IT Employees (Year 2022)
The distribution of average monthly remuneration packageNote of full-time IT employees reveals that employers continue to offer competitive wages to secure and retain highly-skilled IT professionals. Employees engaging in general IT management jobs tended to have higher monthly income from HK$50,001 or more (84.5%), and from HK$30,001 to HK$90,000 for jobs related to research & development (IT related) (64.7%) and IT security (70.0%). These figures offer insights into hiring trends within the IT sector. As this was not a wage survey, the information obtained was for reference purpose only.
Note: The term “remuneration package” includes basic salary, overtime pay, cost of living allowance, meal allowance, housing allowance, travel allowance, commission and bonus.
| Percentage Distribution of Average Monthly Remuneration Package | ||||||||
|---|---|---|---|---|---|---|---|---|
| Job Category | $20,000 or Below | $20,001 - $30,000 | $30,001 - $50,000 | $50,001 - $90,000 | $90,001 or More | |||
| General IT Management | - | 0.1% | 15.4% | 60.4% | 24.1% | |||
| Research & Development (IT related) | 9.5% | 12.9% | 29.4% | 35.3% | 13.0% | |||
| IT Security | - | 29.5% | 35.1% | 34.9% | 0.5% | |||
| IT Education & Training | - | 11.9% | 62.9% | 16.2% | 9.0% | |||
| Data Management | - | 38.4% | 45.3% | 16.2% | 0.1% | |||
| Software Development | 17.9% | 39.1% | 27.3% | 14.6% | 1.1% | |||
| Communications & Networks | 14.0% | 47.0% | 33.3% | 5.5% | 0.3% | |||
| IT Sales & Marketing | 29.4% | 48.3% | 17.5% | 3.8% | 0.9% | |||
| Technical Services | 45.4% | 30.3% | 19.9% | 4.3% | 0.1% | |||
| Infrastructure & Operations Support | 44.3% | 41.3% | 12.1% | 2.2% | 0.1% | |||
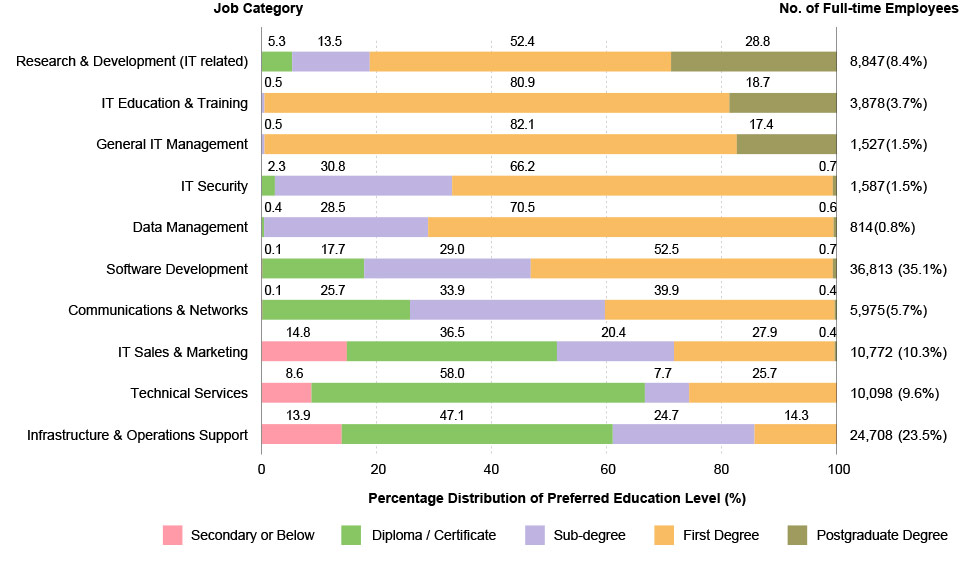
Preferred Education Level of Full-time IT Employees (Year 2022)
The IT industry is one of the most knowledge-intensive sectors and therefore employers generally preferred their IT employees to have job-related experience with tertiary level qualifications for most of the IT posts. According to the 2022 Manpower Survey, 43.5% of IT posts were preferred to have first degree or above qualifications and 22.6% to have sub-degree qualification.
| Percentage Distribution of Preferred Education Level | |||||||
|---|---|---|---|---|---|---|---|
| Job Category | Secondary or Below | Diploma / Certificate | Sub-degree | First Degree | Postgraduate Degree | No. of Full-time Employees | % of Full-time Employees |
| Research & Development (IT Related) | - | 5.3% | 13.5% | 52.4% | 28.8% | 8,847 | 8.4% |
| IT Education & Training | - | - | 0.5% | 80.9% | 18.7% | 3,878 | 3.7% |
| General IT Management | - | - | 0.5% | 82.1% | 17.4% | 1,527 | 1.5% |
| IT Security | - | 2.3% | 30.8% | 66.2% | 0.7% | 1,587 | 1.5% |
| Data Management | - | 0.4% | 28.5% | 70.5% | 0.6% | 814 | 0.8% |
| Software Development | 0.1% | 17.7% | 29.0% | 52.5% | 0.7% | 36,813 | 35.1% |
| Communications & Networks | 0.1% | 25.7% | 33.9% | 39.9% | 0.4% | 5,975 | 5.7% |
| IT Sales & Marketing | 14.8% | 36.5% | 20.4% | 27.9% | 0.4% | 10,772 | 10.3% |
| Technical Services | 8.6% | 58.0% | 7.7% | 25.7% | - | 10,098 | 9.6% |
| Infrastructure & Operations Support | 13.9% | 47.1% | 24.7% | 14.3% | - | 24,708 | 23.5% |
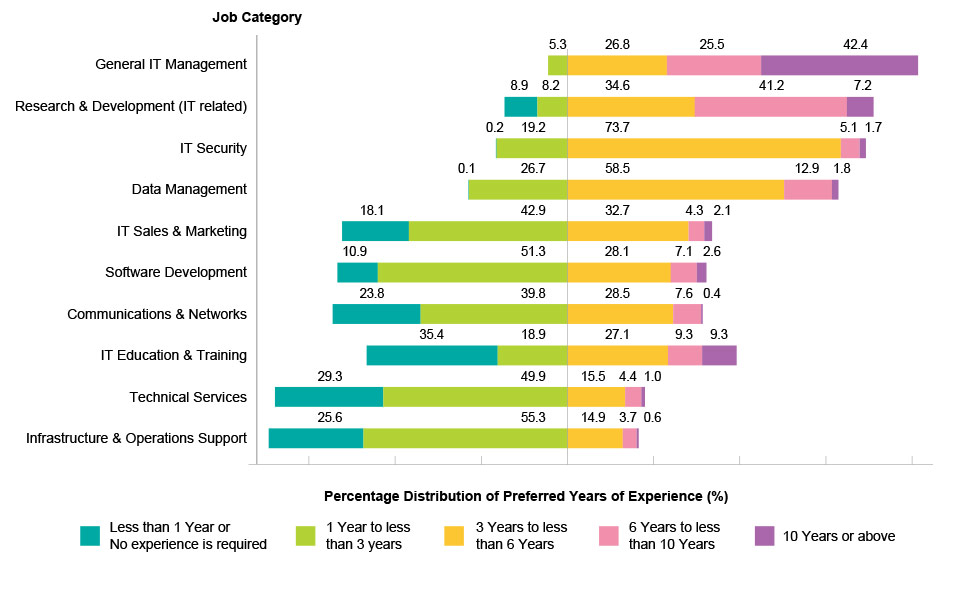
Preferred Years of Experience of Full-time IT Employees (Year 2022)
Employers tended to require full-time IT employees engaging in general IT management to have more relevant experience. Most of them (94.7%) were required to have 10 years or above (42.4%) or 3 years to less than 10 years (52.3%) of experience. On the other hand, those who were required to have less years of experience (less than 3 years) tended to be those engaging in infrastructure and operations support (80.9%) and technical services (79.1%).
| Percentage Distribution of Preferred Years of Experience | ||||||||
|---|---|---|---|---|---|---|---|---|
| Job Category | Less than 1 Year or No experience is required | 1 Year to less than 3 years | 3 Years to less than 6 Years | 6 Years to less than 10 Years | 10 Years or above | |||
| General IT Management | - | 5.3% | 26.8% | 25.5% | 42.4% | |||
| Research & Development (IT Related) | 8.9% | 8.2% | 34.6% | 41.2% | 7.2% | |||
| IT Security | 0.2% | 19.2% | 73.7% | 5.1% | 1.7% | |||
| Data Management | 0.1% | 26.7% | 58.5% | 12.9% | 1.8% | |||
| IT Sales & Marketing | 18.1% | 42.9% | 32.7% | 4.3% | 2.1% | |||
| Software Development | 10.9% | 51.3% | 28.1% | 7.1% | 2.6% | |||
| Communications & Networks | 23.8% | 39.8% | 28.5% | 7.6% | 0.4% | |||
| IT Education & Training | 35.4% | 18.9% | 27.1% | 9.3% | 9.3% | |||
| Technical Services | 29.3% | 49.9% | 15.5% | 4.4% | 1.0% | |||
| Infrastructure & Operations Support | 25.6% | 55.3% | 14.9% | 3.7% | 0.6% | |||